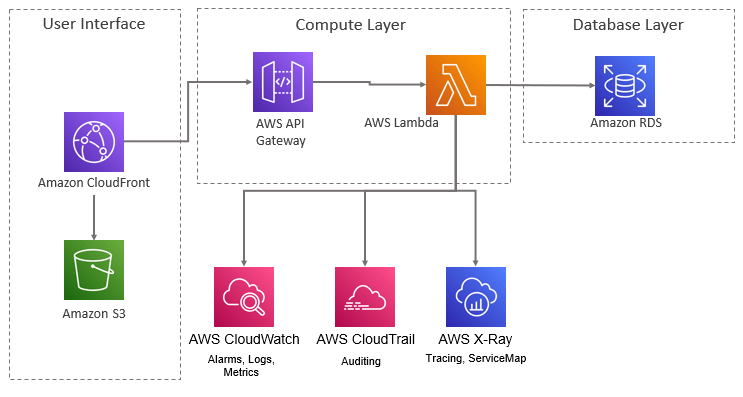
As an architect, designing a robust serverless microservices architecture is just the first step. Ensuring that your application runs smoothly in production requires a solid observability and monitoring strategy. Observability helps you understand how your system behaves, while monitoring helps you track its performance and health in real-time. In this blog, I’ll walk you through the essentials of observability and monitoring in serverless microservices, the tools you can use, and how to implement them effectively. I am assuming the microservices are implemented in AWS serverless stack using Lambda Functions.
What is Observability?
Observability is the ability to understand the internal state of a system by examining the outputs it produces. It helps in detecting and diagnosing issues, understanding system behavior, and improving performance and reliability. Observability is often broken down into three key pillars:
- Logs: Logs are detailed records of events and actions within the system. They provide a chronological sequence of events that have occurred, which is essential for debugging and auditing. In a serverless environment, each Lambda function invocation generates logs that capture input events, execution details, and any errors that occur.
- Metrics: Metrics are numerical data points that indicate the performance and health of the system. They provide insights into various aspects like response times, error rates, and resource utilization. Metrics help in identifying trends and anomalies, enabling proactive performance management.
- Traces: Traces record the journey of requests through the system, showing how they propagate across various services. Tracing helps in understanding the flow of data and identifying latency issues or bottlenecks. In a microservices architecture, tracing is crucial for gaining visibility into complex, distributed interactions.
Why Monitoring Matters
Monitoring complements observability by actively tracking the performance and health of your system. It involves setting up alerts and dashboards to notify you of any anomalies or issues. In a serverless environment, where functions are ephemeral and dynamically scaled, monitoring becomes crucial. Without proper monitoring, it can be challenging to detect and resolve issues promptly, leading to potential downtime and degraded user experience.
Tools for Observability and Monitoring
In the AWS ecosystem, several tools can help you achieve comprehensive observability and monitoring:
- Amazon CloudWatch: CloudWatch is a monitoring and management service that provides data and actionable insights for AWS, hybrid, and on-premises applications. It offers several features:
- Logs: CloudWatch Logs can collect and store logs from your Lambda functions. You can search, filter, and analyze the logs to troubleshoot issues.
- Metrics: CloudWatch collects metrics such as invocation count, duration, and error rates from Lambda functions. You can create custom metrics using the CloudWatch Embedded Metric Format (EMF).
- Alarms: CloudWatch Alarms allow you to set thresholds for specific metrics and trigger alerts when these thresholds are breached. This helps in proactively managing system health.
- AWS X-Ray: X-Ray helps you analyze and debug production applications by providing end-to-end tracing of requests. It offers:
- Traces: X-Ray records traces of requests as they travel through your application, helping you identify performance bottlenecks and issues.
- Service Map: The service map visualizes the interactions between services and highlights any performance issues, making it easier to understand the dependencies and flow within your system.
- AWS CloudTrail: CloudTrail provides event history of your AWS account activity, including actions taken through the AWS Management Console, AWS SDKs, command-line tools, and other AWS services. This is useful for:
- Auditing: CloudTrail logs all API calls, which helps in auditing and compliance by providing a detailed history of changes and access patterns.
- Third-Party Tools:
- Datadog: Datadog is a monitoring and observability platform that integrates with AWS Lambda. It provides real-time logs, metrics, and traces, along with customizable dashboards and alerts.
- New Relic: New Relic offers detailed insights into application performance, helping you monitor and optimize your serverless applications.
- Prometheus and Grafana: Prometheus is an open-source monitoring tool that scrapes metrics from various sources. Grafana is an open-source visualization tool that can be used with Prometheus to create custom dashboards and visualizations.
Implementing Observability and Monitoring
Let’s walk through the steps to implement observability and monitoring for your serverless microservices architecture.
Step 1: Enable CloudWatch Logs
- Lambda Function Configuration: Ensure that your Lambda functions are configured to send logs to CloudWatch. You can use the
contextobject in your function to log custom messages. For example:
   import logging
   logger = logging.getLogger()
   logger.setLevel(logging.INFO)

   def lambda_handler(event, context):
       logger.info('Processing event: %s', event)
       # Your function logic here
This will ensure that all log messages are captured and sent to CloudWatch Logs.
- Log Retention Policy: Set an appropriate retention policy for your logs in CloudWatch to manage costs. By default, logs are stored indefinitely, which can lead to high storage costs. You can set a retention period based on your needs (e.g., 7 days, 30 days, etc.).
Step 2: Configure CloudWatch Metrics and Alarms
- Metrics: Use built-in metrics such as
Invocations,Duration,Errors, andThrottlesto monitor your Lambda functions. You can also create custom metrics using CloudWatch Embedded Metric Format (EMF) to capture application-specific data. For example:
   import json
   import boto3

   def lambda_handler(event, context):
       metric_data = {
           "_aws": {
               "Timestamp": int(time.time() * 1000),
               "CloudWatchMetrics": [
                   {
                       "Namespace": "MyApp/Metrics",
                       "Dimensions": [["FunctionName"]],
                       "Metrics": [{"Name": "CustomMetric", "Unit": "Count"}]
                   }
               ]
           },
           "FunctionName": context.function_name,
           "CustomMetric": 1
       }
       print(json.dumps(metric_data))
- Alarms: Set up alarms for critical metrics to receive notifications when thresholds are breached. For example, you can set an alarm for high error rates:
   AlarmName: "High Error Rate"
   MetricName: "Errors"
   Namespace: "AWS/Lambda"
   Statistic: "Sum"
   Period: 60
   EvaluationPeriods: 1
   Threshold: 5
   ComparisonOperator: "GreaterThanOrEqualToThreshold"
This alarm will trigger if the error count exceeds 5 within a 60-second period, allowing you to respond quickly to issues.
Step 3: Implement Tracing with AWS X-Ray
- Enable X-Ray for Lambda: Enable X-Ray tracing in your Lambda function settings. This can be done via the AWS Management Console or by adding the following to your function configuration:
   {
       "TracingConfig": {
           "Mode": "Active"
       }
   }
This will automatically capture traces for each invocation.
- Add the X-Ray SDK: Use the X-Ray SDK to trace custom segments and annotations within your functions. For example:
   from aws_xray_sdk.core import xray_recorder
   from aws_xray_sdk.core import patch_all

   patch_all()

   def lambda_handler(event, context):
       with xray_recorder.in_segment('MySegment') as segment:
           # Your function logic here
           segment.put_annotation('key', 'value')
This will help you trace specific parts of your function and add custom metadata for better analysis.
- Service Map and Traces: Use the X-Ray console to view the service map and traces. The service map provides a visual representation of your microservices and their interactions, while the traces show detailed information about request propagation and performance bottlenecks.
Step 4: Integrate Third-Party Tools
- Datadog Integration: Use the Datadog Lambda Layer to send logs, metrics, and traces to Datadog. Add the Datadog layer to your Lambda function and configure it to send data. For example:
   Layers:
     - arn:aws:lambda:<region>:464622532012:layer:Datadog-Extension:18
   Environment:
     Variables:
       DD_API_KEY: "<your-datadog-api-key>"
Datadog provides detailed dashboards, alerts, and real-time insights into your Lambda functions.
- Prometheus and Grafana: Set up Prometheus to scrape metrics from your Lambda functions. This requires a custom implementation to export metrics in a Prometheus-compatible format. Use Grafana to visualize these metrics and create custom dashboards. Grafana provides powerful visualization capabilities and supports various data sources, including Prometheus.
Implementing a robust observability and monitoring strategy for your serverless microservices architecture is essential for maintaining performance, reliability, and security. By leveraging AWS tools like CloudWatch and X-Ray, along with third-party solutions like Datadog and Grafana, you can gain deep insights into your system’s behavior and quickly respond to any issues.
Stay proactive with your monitoring efforts and continuously refine your observability practices to ensure your serverless applications run smoothly and efficiently.

Leave a comment